Today in this tutorial, we will see how we can plot multiple graphs in python using the Matplotlib library.
The Matplotlib is one of the most used library for data visualization. This means you can plot any type of chart like columns chart, line chart, bar chart, pie chart, scatter chart, etc.
So we will use this Matplotlib library to draw the multiple graphs in a single plot. Let’s start with the tutorial, first, we will see how to plot a single graph using Matplotlib and then how we can draw multiple graphs on the same plot.
Plot Single Graph Using Matplotlib
To drow the single plot graph in python, you have to first install the Matplotlib library and then use the plot() function of it.
After installation, now we will import it into a python file and use the plot() function to draw the simple graph.
In the output of the above code, you will see the graph like the following image.

So in the above code, first we defined the x-axis and y-axis values using the NumPy. Then we used the plot() function to draw the graph on canvas.
Set the labels for the x-axis and y-axis using the set() function, you can also use the direct xlabel() and ylabel() functions.
And in the last, we set the main title of the plot and then show the graph on canvas using the show() function, and for saving images used the savefig() function.
Let’s see one more example of a simple plot in python.
Now in this above, we took another example by taking x-axis and y-axis values and using the direct xlabel() and ylabel() function to set the labels for both side.
Let’s now see how we can plot multiple graphs in python using the Matplotlib library. Moreover, we will see some useful examples.
Plot Multiple Graphs Using Matplotlib
Now we will discuss how we can use the matplotlib library to draw the multiple graphs in python. Plot multiple means we can draw multiple graphs on the same canvas with the same code script.
So we will use the subplot() or subplots() function of matplotlib library to draw the multiple graphs. See the syntax of it.
Let’s see the examples of both functions.
Using subplots() Function
The subplots() function is the main wrapper function that allows us to plot more than one graph on a single canvas by calling it once.
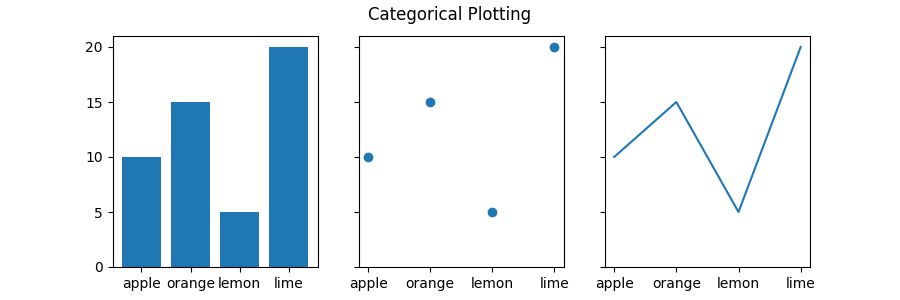
Let’s see the example of plotting bar chart, scatter chart, and line chart using the subplots() function of matplotlib which will have one main title.
Example 1

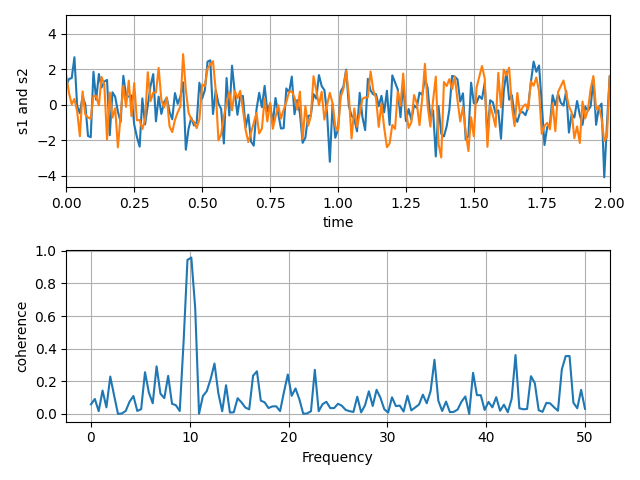
Example 2

You can see the more examples of subplots() function on the matplotlib.org site.


